Business events dashboard
The business events dashboard helps follow domain events emitted by boruta applications from the administration interface. It focuses on application-level activity such as authorization, token exchange, direct post, and revocation operations. This view is useful to understand whether a flow reached the expected business step, whether it succeeded or failed, and which client, subject, token, or error details were attached to the operation.
Purpose
This dashboard is intended to observe business-level outcomes rather than raw HTTP traffic. It helps answer questions such as:
- Which authorization actions were executed?
- Which token operations succeeded or failed?
- Which domain and action generated the most events?
- Which client or subject was involved in a business operation?
- Which error details were emitted by a failed event?
It is useful when an HTTP request reached boruta successfully but the expected authorization, token, or revocation behavior did not happen.
Filters
The dashboard can be filtered by:
- Date range - restricts displayed metrics and logs to the selected time window.
- Application - focuses the dashboard on one boruta application, for example
boruta_web. - Domain - filters events by their business domain.
- Action - filters events by the operation that was performed.
Triggering the Filter button refreshes the event counters, chart, summary, and log trail according to the selected values.
For most investigations, select the application first, then narrow the dashboard with the domain and action filters. This keeps the chart and log trail focused on one part of the authorization flow.
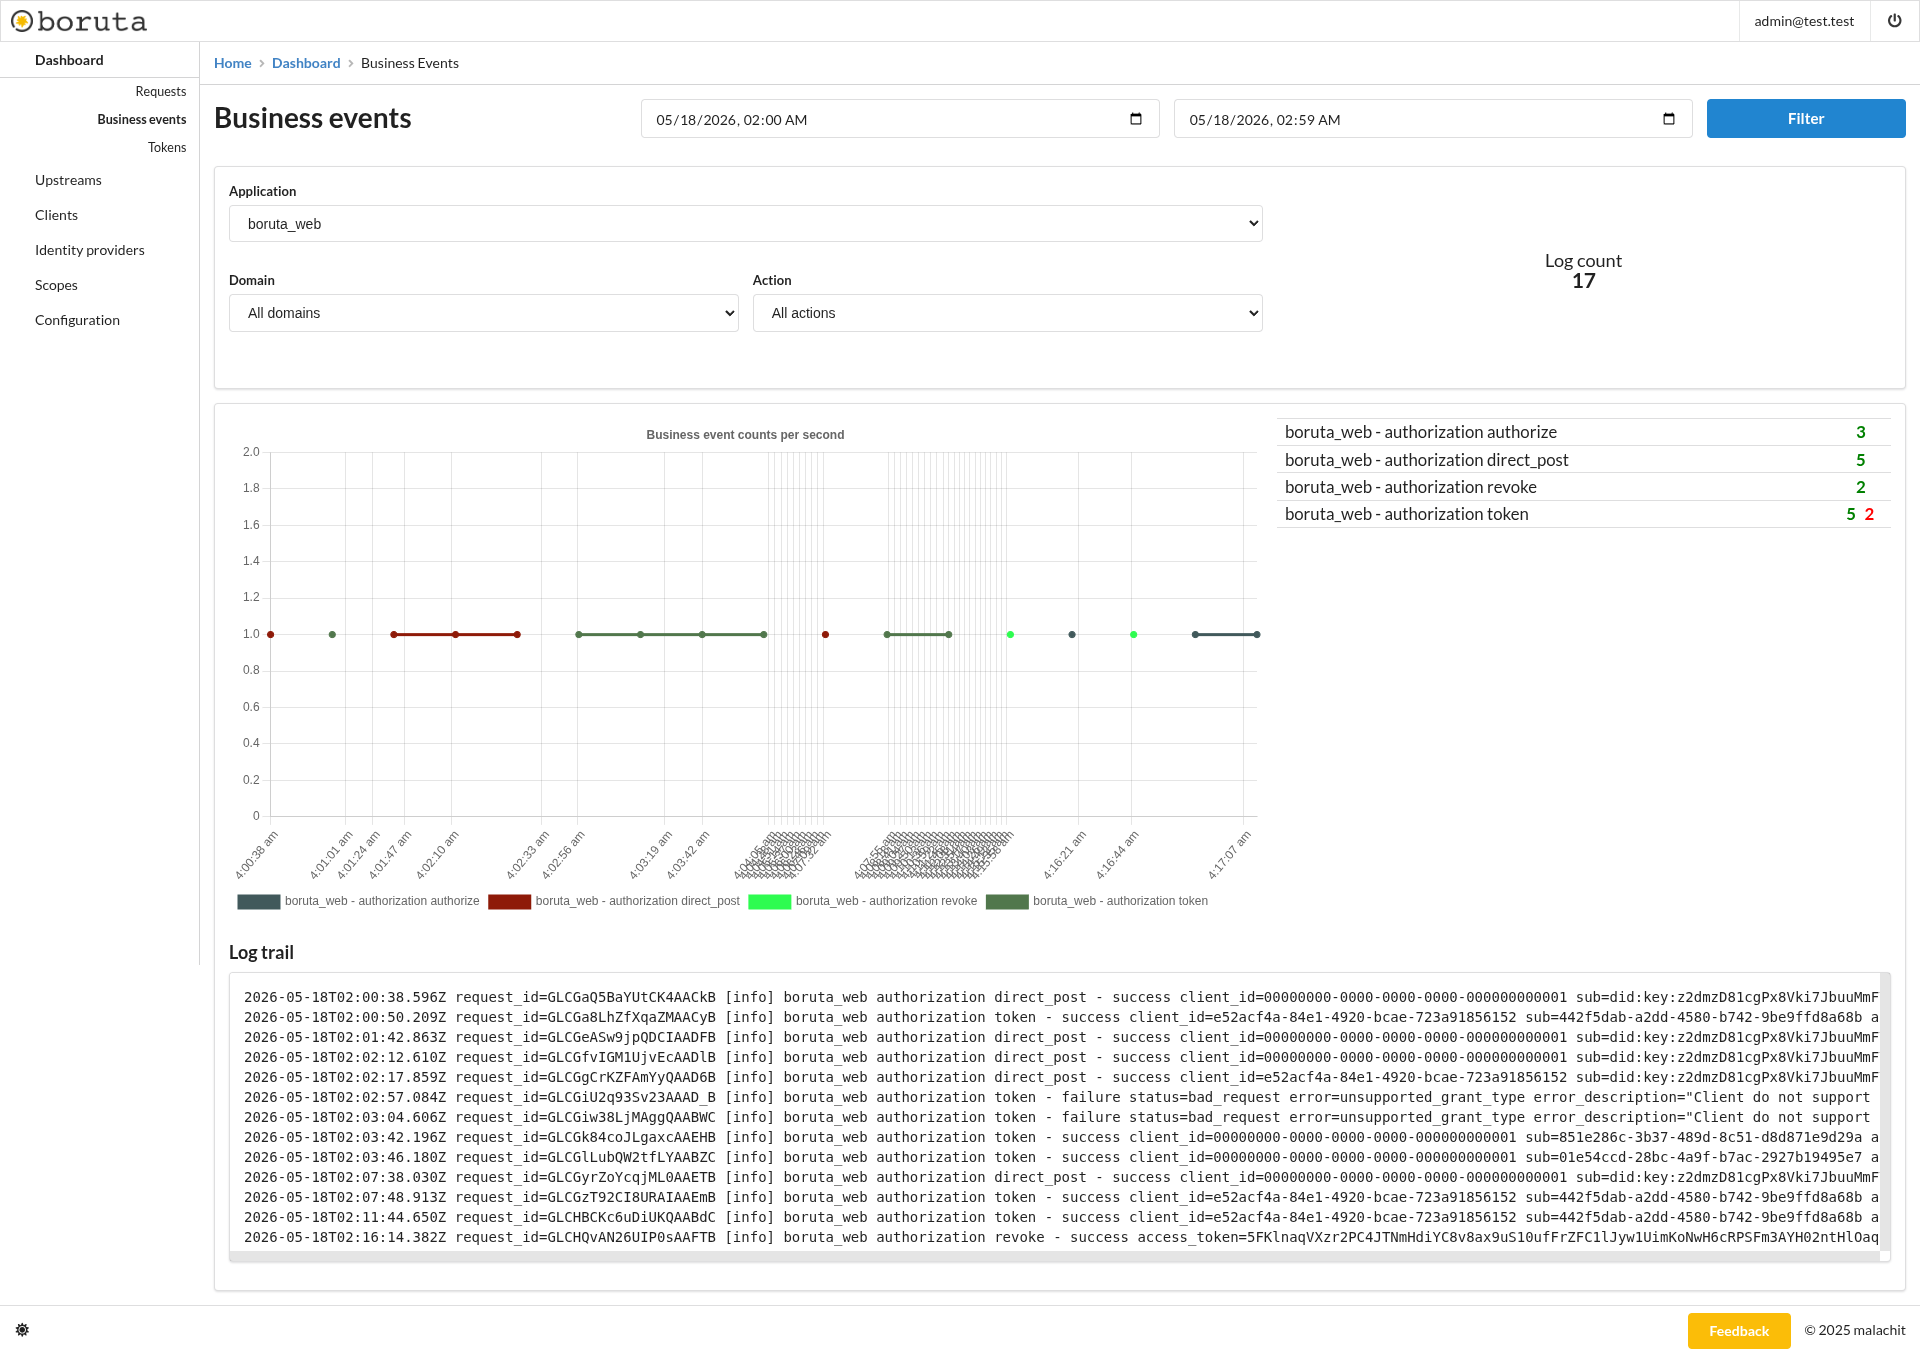
Metrics
The log count gives the total number of business event log entries matching the current filters.
The business event counts per second chart displays how often matching business events occur over time. Each series represents an application, domain, and action combination.
The summary on the right lists event groups and their counts. Successful events are displayed separately from failure counts, helping identify which actions are producing errors.
Reading the events
Business events are grouped by application, domain, and action. For example, authorization events can expose operations such as authorize, direct_post, token, or revoke.
Success counts indicate completed business operations. Failure counts indicate that the operation was reached but rejected or failed, often with an error and error description in the log trail.
This distinction is important: a failed business event does not always mean the server failed. It can also represent an expected protocol rejection, such as an unsupported grant type, invalid client input, or revoked token.
Log trail
The log trail displays raw business event log lines for the current filters. It is useful to inspect event context such as request identifiers, event status, client identifiers, subjects, access tokens, and error details.
The request_id value can be used to correlate a business event with the HTTP request that triggered it. This makes it possible to move from a failed request in the requests dashboard to the exact business decision recorded here.
Investigation workflow
- Start from the time range where the issue occurred.
- Filter by application, then by domain and action.
- Compare success and failure counts in the event summary.
- Inspect the corresponding log lines for
client_id,sub, status, error, and error description. - Use the
request_idto correlate the event with the requests dashboard when HTTP context is needed.
Navigation
- HTTP traffic monitoring - Requests dashboard
- Token monitoring - Tokens dashboard