Requests dashboard
The requests dashboard helps monitor HTTP traffic received by boruta applications from the administration interface. It gives operators a consolidated view of request volume, HTTP status distribution, response times, and raw request logs over a selected period. This makes it possible to understand how users and clients interact with boruta endpoints, detect abnormal traffic patterns, and correlate an HTTP request with the business events produced during the same flow.
Purpose
This dashboard is intended for operational monitoring and first-level investigation of HTTP activity. It helps answer questions such as:
- Which application received traffic during a time range?
- Which endpoints were called?
- Which status codes were returned?
- Did response times increase for a specific request label?
- Which raw log line corresponds to a visible metric point?
It is especially useful when validating an integration, debugging an authentication tunnel, or checking the behavior of the identity provider and wallet endpoints.
Filters
The dashboard can be filtered by:
- Date range - restricts displayed metrics and logs to the selected time window.
- Application - focuses the dashboard on one boruta application, for example
boruta_identity. - Request label - filters requests by their normalized label, such as an HTTP method and route.
Triggering the Filter button refreshes the charts, counters, and log trail according to the selected values.
When investigating a specific behavior, start with a narrow date range and the target application. Then use the request label filter to focus on one endpoint family.
Metrics
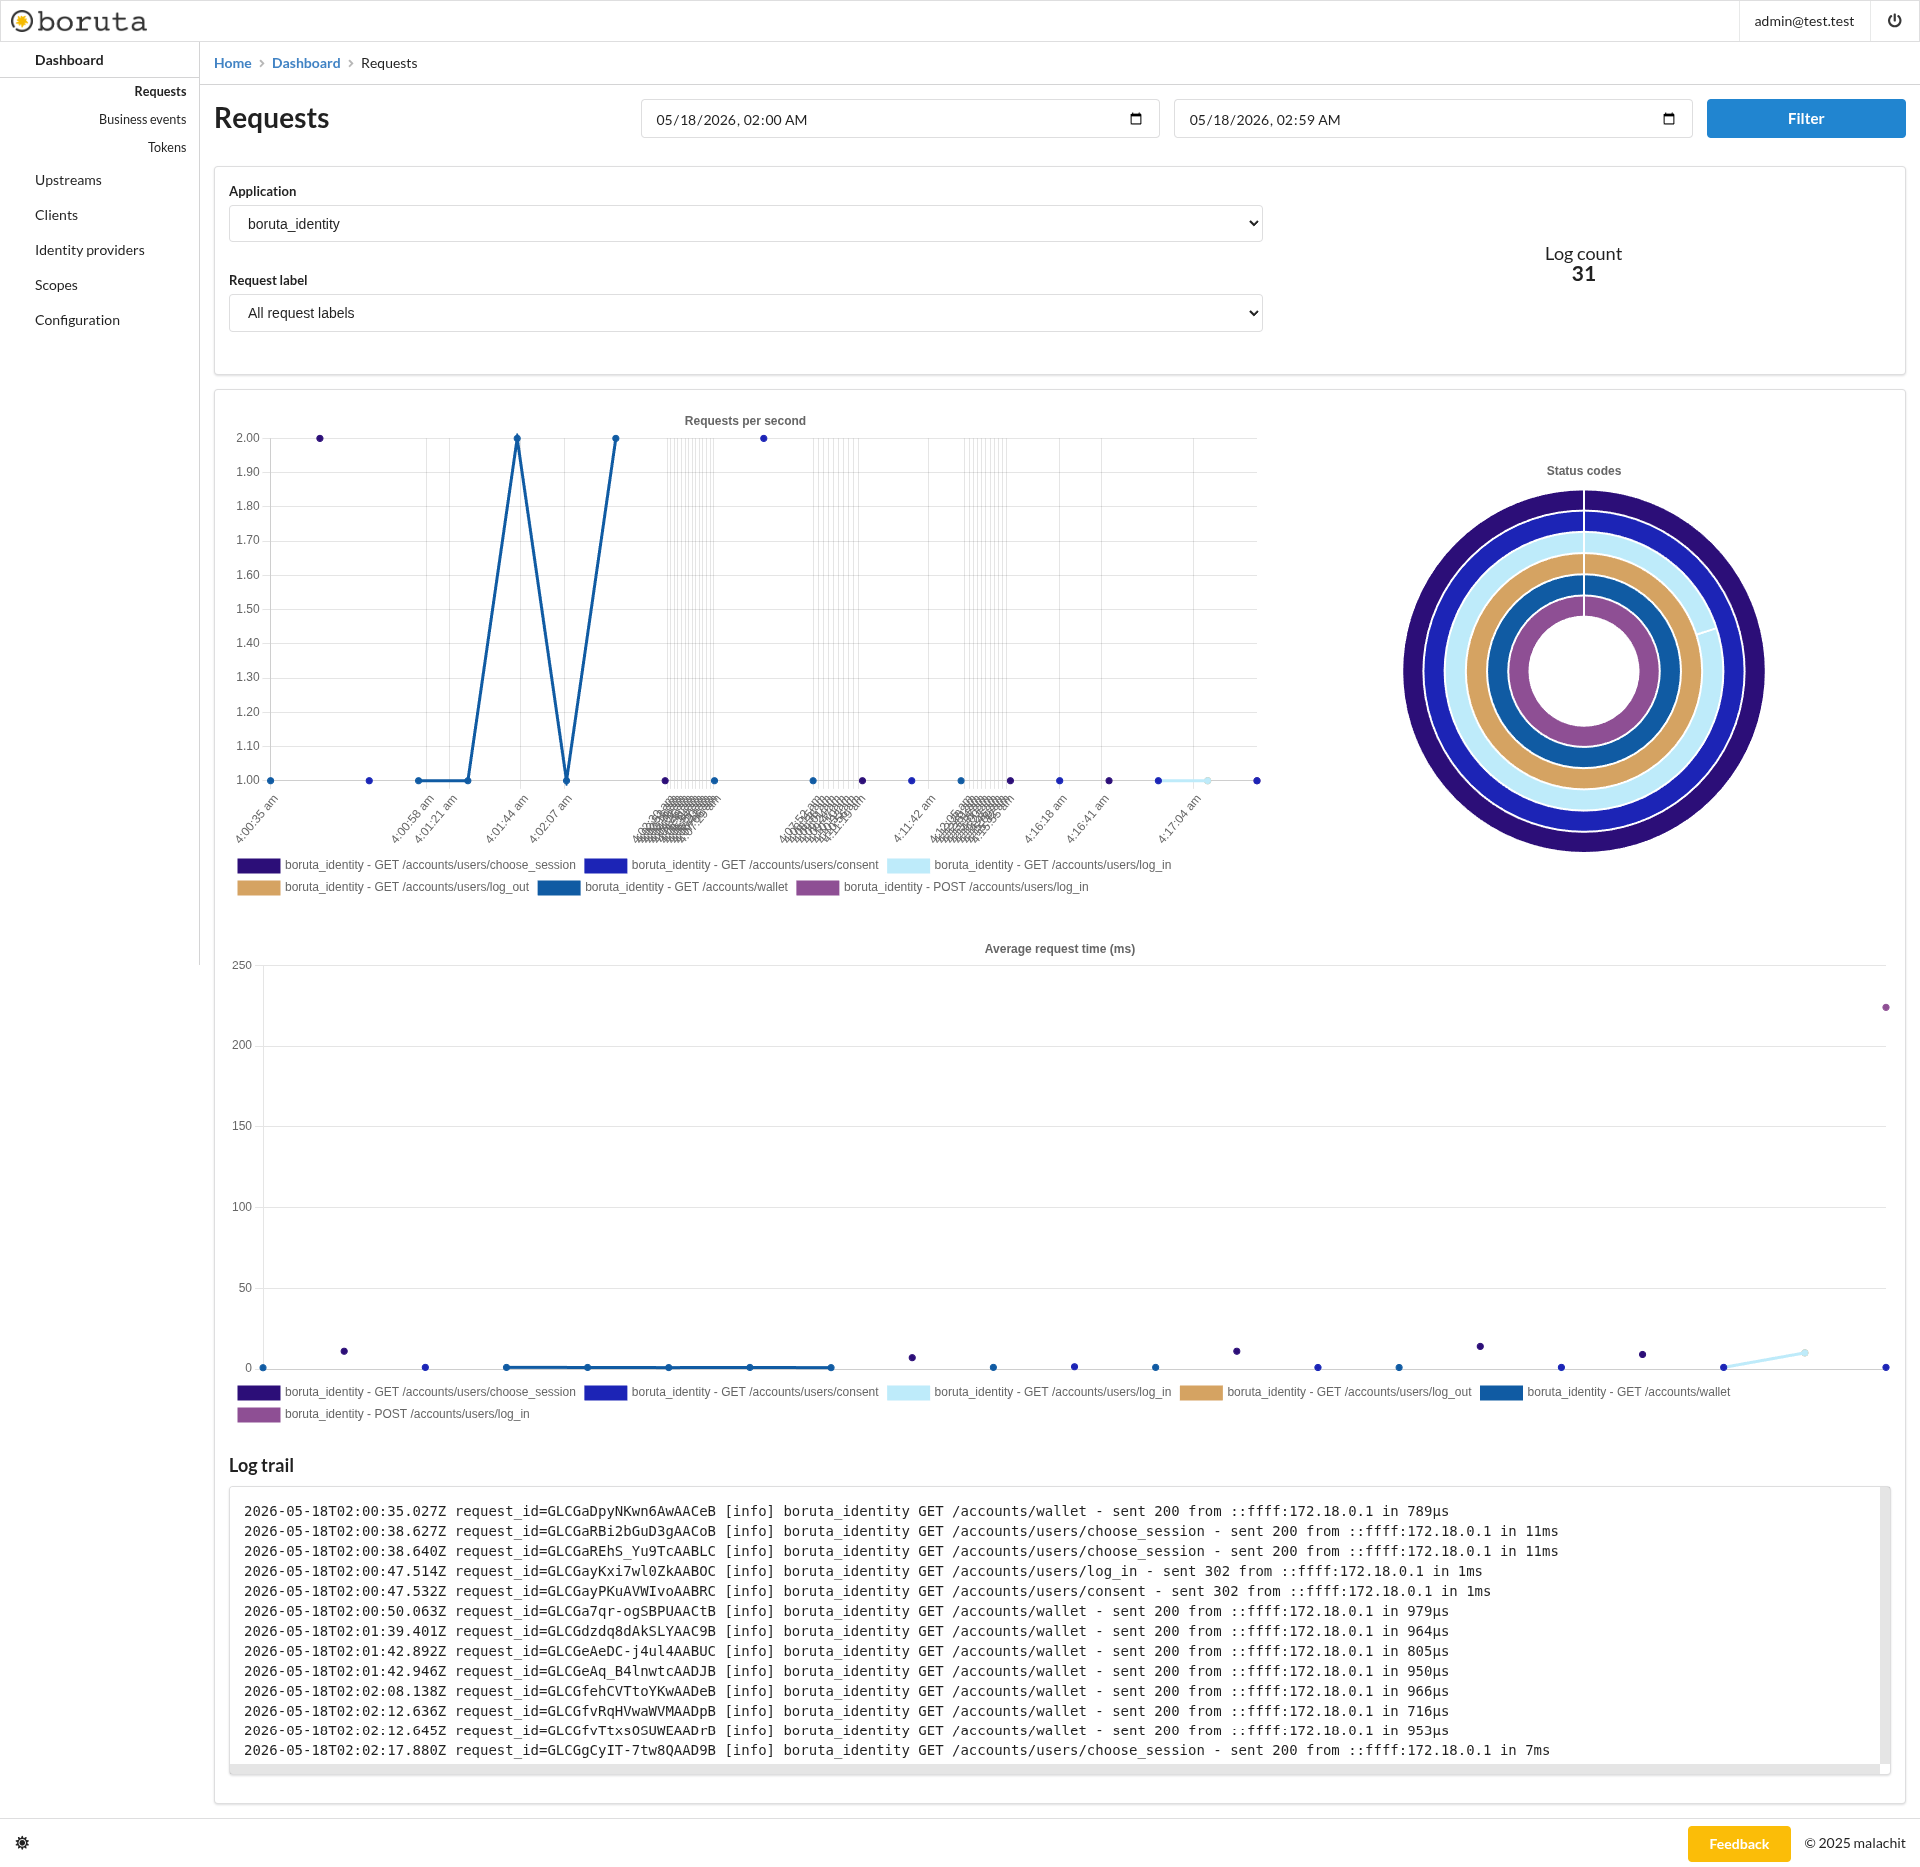
The log count gives the total number of request log entries matching the current filters.
The requests per second chart displays request throughput over time. Each series represents a request label, helping identify which endpoints are receiving traffic and when the traffic occurs.
The status codes chart shows the distribution of returned HTTP statuses. It helps verify whether traffic is mostly successful or if errors and redirects are increasing.
The average request time chart displays response time evolution in milliseconds. It helps identify slow endpoints or latency spikes during the selected period.
Reading the charts
The request volume chart should be read together with the status code chart. A traffic increase with stable successful status codes usually means normal usage, while a traffic increase with more 4xx or 5xx responses can indicate a client configuration or server-side issue.
The average request time chart is useful to detect slow responses even when the request count stays low. A single high point can correspond to one slow request, while repeated high values usually deserve a closer look at the affected endpoint and backend dependencies.
Log trail
The log trail displays raw request log lines for the current filters. It is useful to inspect individual requests with their request identifier, application, route, status, source address, and response time.
The request_id value can be used to correlate a request log with business events emitted during the same flow. This is useful for tracing a complete authorization, login, or wallet interaction from the HTTP entry point to the business operation.
Investigation workflow
- Select the time window where the behavior occurred.
- Select the application that handled the request.
- Use the request label filter to isolate the endpoint.
- Compare request volume, status codes, and average request time.
- Inspect the log trail and keep the
request_idfor correlation with business events.
Navigation
- Business events monitoring - Business events dashboard
- Token monitoring - Tokens dashboard